

Monad ended August larger than Ethereum for the first time, closing at $385.6M against $334.3M. Across the protocol Euler's dollar deposits rose 5.9% while its loan book shrank slightly, in a month when every major lending protocol grew and the sector median was 7.0%. On the two chains holding three quarters of the book, deposits rose 3.3% in dollars and fell 2.7% once collateral repricing is removed.
Figures cover 1 to 31 August 2026. Fees and revenue are rebuilt first-party from Euler's contracts, covering all 31 days on both sides of the month-on-month, because DefiLlama's fee adapter stopped reporting after 22 August. Methodology, coverage and named gaps are at the end.
Euler's deposits rose 5.9% in dollars while its loan book shrank. On the two chains holding three quarters of the protocol, revaluing end-of-month collateral at 1 August prices turns a 3.3% gain into a 2.7% decline. The growth was the collateral, not the deposits.
Key takeaways
- Gross deposits averaged $950.5M, up 5.9% on July and down 65.3% year on year. Active loans averaged $591.3M, down 0.1%. Deposits grew and borrowing did not.
- The growth was market-wide, and Euler captured less of it than most. All ten major lending protocols grew in August. Sector median +7.0%; Euler +5.9%, seventh of ten. Aggregate deposits across the group rose 11.3%.
- August's dollar figures overstate deposit growth. ETH rose 31.1%, BTC 24.2% and XRP 29.0% over the same window.
- On a price-neutral basis the book shrank. Revaluing end-August collateral at 1 August prices removes $38.0M, 5.8% of the covered book. Ethereum and Monad together rose 3.3% in dollars and fell 2.7% in real terms.
- Monad ended August larger than Ethereum, $385.6M against $334.3M. It led on only 7 of 31 days, and continuously from 28 August after a single day cut $47.7M from Ethereum's book.
- Euler runs the most intensively lent book in lending on both measures: 153.6% loans to net deposits and 60.6% utilization, first of ten on each. That comes from looping, which concentrates liquidation risk in the same place it creates efficiency.
- Two curators run most of the protocol. Sentora curates 67.5% of Ethereum, K3 Capital 74.5% of Monad, together 71.3% of what was read on-chain. Anyone can deploy a vault on Euler; far fewer underwrite one.
- Borrowers paid $2.0M of interest and Euler accrued $51.7K, a 2.60% take rate, none of which reached it on Ethereum. The protocol's share of the interest fee was set to zero on 12 May 2026 by proposal, and the fee transfers show it collecting 0.0% since June. EUL buybacks have been paused by a separate proposal, with no auction in 142 days.
The month in one number, and why it is the wrong one
Gross deposits averaged $950.5M in August, up 5.9% on July. Active loans averaged $591.3M, down 0.1%.
That divergence is the first thing worth noticing. Deposits grew by roughly $53M on the month while borrowing fell slightly, so none of the additional capital was lent out. Utilization fell with it, from 62% at the end of July to 60.6%.
Context is heavier still. Deposits peaked at $4.21B on 7 October 2025, and the book closed August 77.4% below that. Two of the intervening months have been positive, so the direction has changed while the distance has not.
The more useful question is whether 5.9% says anything about Euler at all.
Everyone grew
It does not. Measured identically across the ten largest lending protocols, over the same window and on the same gross basis, every one of them grew in August.
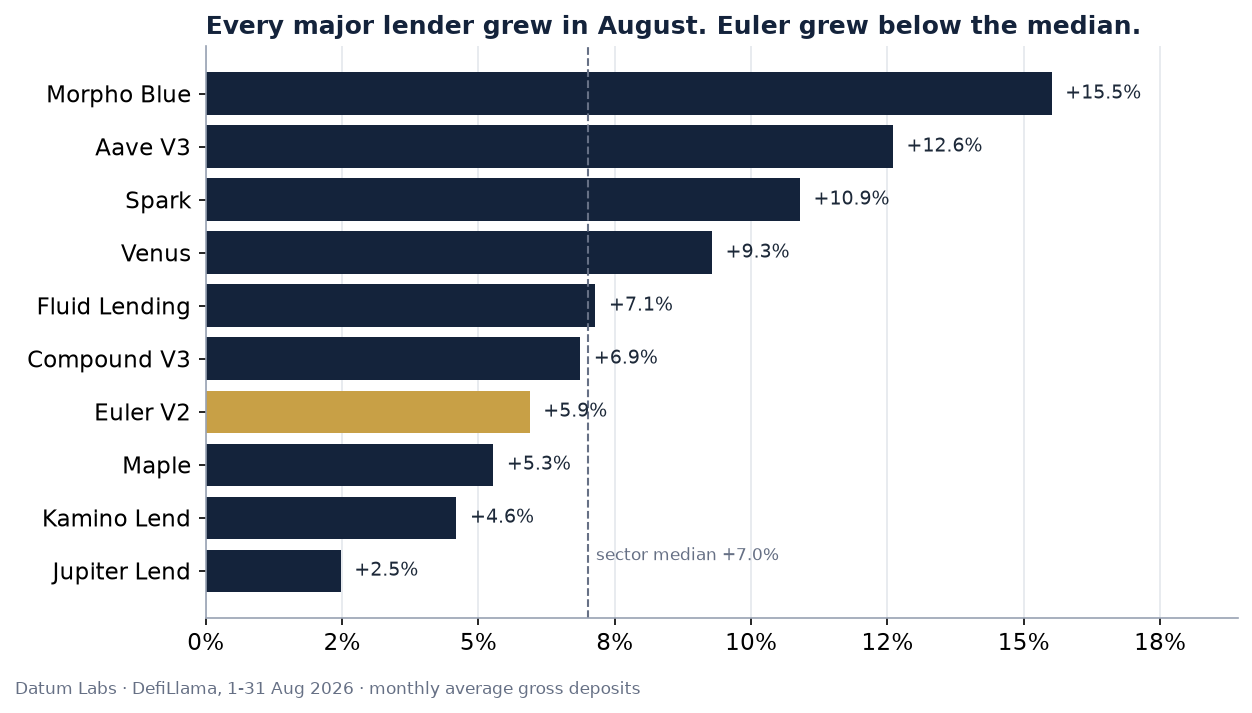
Sector median growth was +7.0%. Euler grew +5.9%, seventh of ten, behind Fluid (+7.1%), Compound V3 (+6.9%) and Venus (+9.3%). Aggregate deposits across the group rose from $54.66B to $60.84B, up 11.3%, with Morpho Blue (+15.5%) and Aave V3 (+12.6%) taking most of it.
A month in which everything rises describes conditions. Euler also remains the smallest of the ten at $950.5M against Aave V3's $26.70B, so an identical percentage represents a far smaller absolute gain.
What a dollar measured
The denominator deserves scrutiny before the growth figure is accepted at all.
| Asset | 1 Aug | 31 Aug | Change |
|---|---|---|---|
| Ethereum | $1,864.93 | $2,445.02 | +31.1% |
| Bitcoin | $63,013.10 | $78,282.14 | +24.2% |
| XRP | $1.06 | $1.37 | +29.0% |
Deposits are denominated in dollars, and the assets sitting in them appreciated by roughly a quarter to a third over the month. Single-digit dollar growth against that backdrop does not establish that new capital arrived. The effect scales with how much volatile collateral a book holds, and disappears where collateral is stablecoins.
For most lenders that has to remain a caveat. For Euler it can be measured directly, because the vault contracts publish token quantities.
The growth that was not growth
Every Euler market is an ERC-4626 vault listed by its factory, so the book can be read directly: 1,017 vaults across Ethereum and Monad, holding 76.2% of the protocol. That read returns token quantities rather than dollar values, which makes the counterfactual exact rather than estimated.
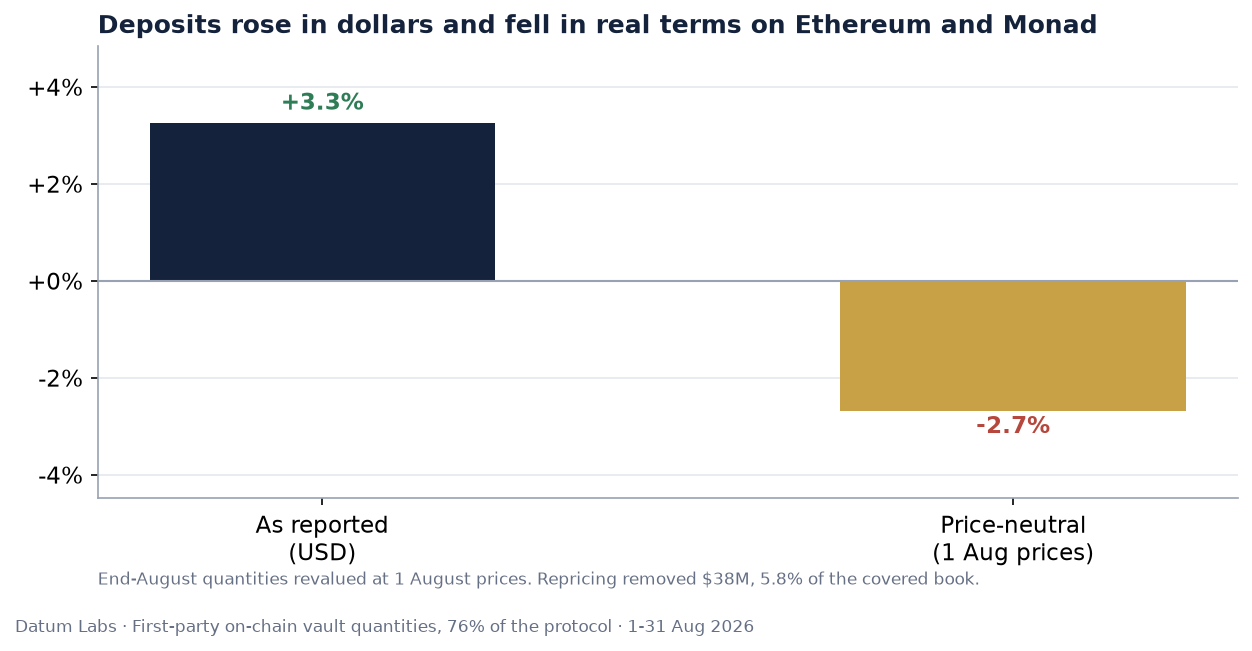
The method revalues end-of-month quantities at start-of-month prices. Reported gross is those quantities at 31 August prices; price-neutral gross is the same quantities at 1 August prices. Because both legs use end-of-month quantities, the comparison needs no assumption about how composition moved during the month.
It also checks itself. Every ETH-linked asset in the book moved between +30.8% and +31.5% over the window, and every dollar-denominated asset moved between -0.0% and +0.6%. That clean separation is what the method rests on, and it is visible in the measured data rather than assumed from an asset's name.
| Basis | 1 Aug | 31 Aug | Change |
|---|---|---|---|
| As reported (USD) | $697.2M | $719.9M | +3.3% |
| Price-neutral | $697.2M | $678.5M | -2.7% |
Repricing accounts for $38.0M, 5.8% of the covered book. Euler's deposits rose in dollars and fell in real terms.
The effect concentrates where the volatile collateral sits. Monad's book repriced by $33.2M, 9.4% of its gross, against Ethereum's $4.8M, or 1.6%, because Ethereum's collateral is almost entirely dollars. Read through utilization the measure moves the other way from the headline: 56.8% reported becomes 60.3% price-neutral across the two chains, because the denominator shrinks while the loans do not. Under a sensitivity that revalues the debt leg as well, price-neutral utilization lands at 57.6%, still above the reported figure.
Monad ended the month larger than Ethereum
The deposit growth also arrived in one place. Monad added $81.1M over the month while Ethereum lost $58.4M and Plasma lost $24.7M.
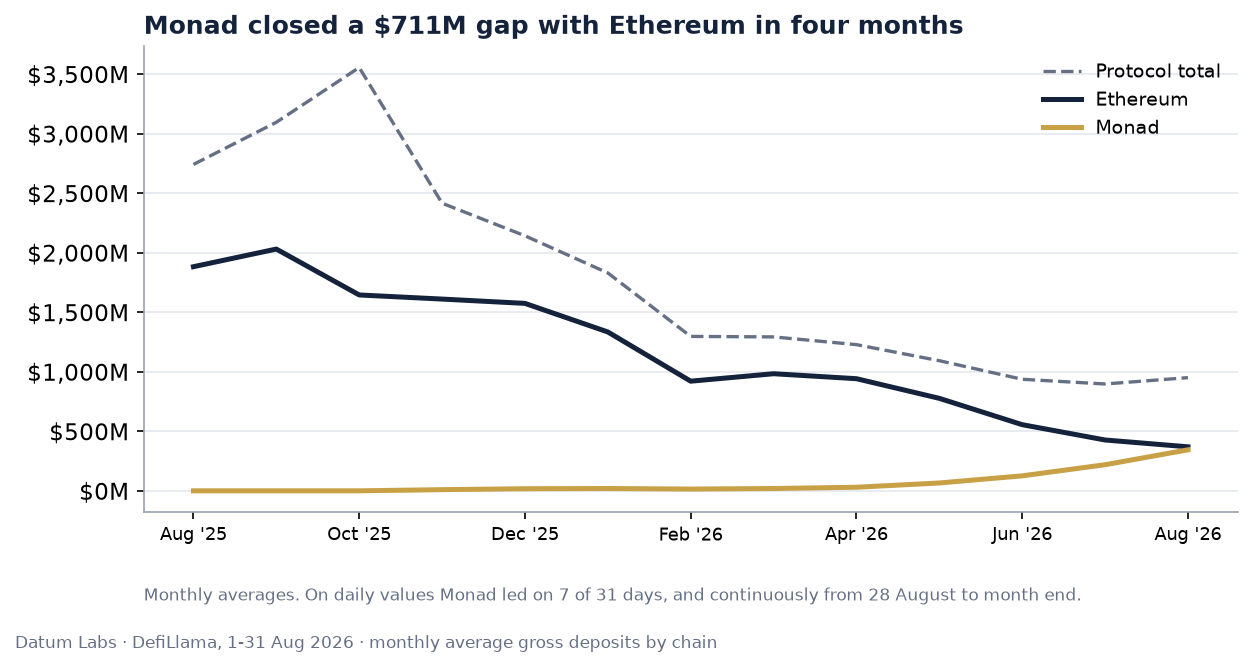
Monad closed August at $385.6M, 40.6% of the book, against Ethereum's $334.3M, or 35.2%. The crossover was not clean: Monad first moved ahead on 23 August, gave the lead back on the 26th and 27th, and has been ahead continuously since the 28th, leading on 7 of 31 days in total.
The decisive move was a single day, and its shape is worth reading carefully. On 28 August Ethereum's gross fell $47.7M, from $377.7M to $330.1M. Outstanding debt accounted for $42.9M of that, while net deposits fell only $4.8M. Debt down $42.9M against almost no change in idle liquidity is a levered position closing rather than ordinary repayment: the borrowed funds had themselves been redeposited as collateral, so unwinding removed both in one movement.
The longer trend sits on a different basis and is worth separating from those month-end figures. Comparing monthly averages, Ethereum has fallen 52% since May while Monad has grown 5.2 times, narrowing the gap between them from $711M in May, when Ethereum averaged $777M against Monad's $66M, to $25M in August, at $370M against $344M. On that averaged basis Ethereum is still marginally ahead. The crossover belongs to the last days of August rather than to the month as a whole.
The two deployments are structurally different businesses. Ethereum runs at 72.5% utilization against Monad's 35.9%, and Monad's largest vaults hold collateral with no borrowing against it at all: vUSD ($73.6M), wstETH ($41.9M), a Pendle principal token ($36.2M) and gAUSD ($24.7M) sit there with zero loans. Ethereum is a drawn lending book. Monad is a collateral warehouse where the borrowing has not arrived.
That distinction matters for what the growth is worth, because the two chains do not pay the same.
The hardest-working book in lending
Euler runs the highest loans-to-net-deposits ratio of any major lender, at 153.6%, and the highest utilization, at 60.6%. It is first of ten on both, ahead of Fluid Lending (113% and 53%) and far ahead of Aave V3 (71% and 42%).
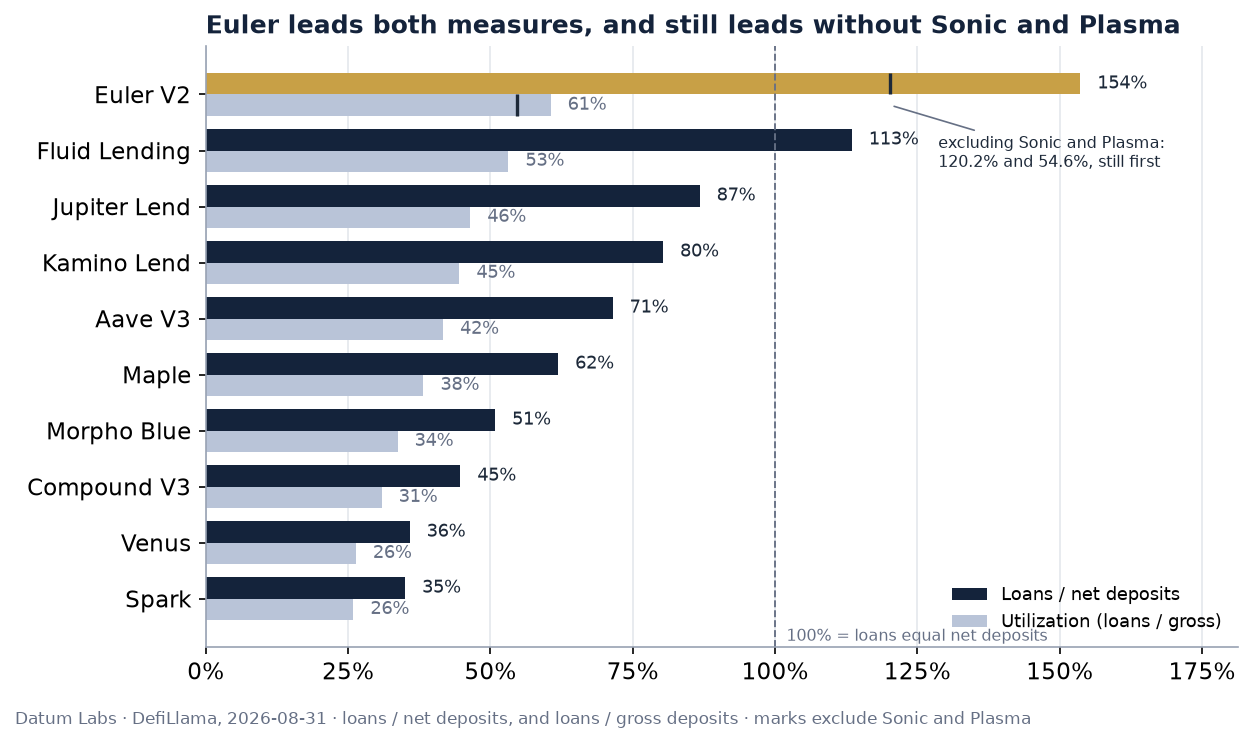
A ratio above 100% means borrowed balances exceed net deposits, which is only possible through looping. A borrower deposits collateral, borrows against it, redeposits what was borrowed and borrows again. Each turn adds to outstanding loans while the unborrowed cash in the vaults stays roughly flat, so the same base capital ends up backing several layers of debt. Euler's Ethereum Vault Connector is built to make that chaining possible across vaults.
Both readings are true and this report picks neither. It is efficient: more of every deposited dollar is working than at any competitor. It also concentrates risk, because a move against looped collateral unwinds through every layer at once, and the free liquidity that would absorb it is thin by construction.
That leadership needs one qualification, because a drawn balance is not always a working one. Plasma holds 18.2% of Euler's loan book and produces 1.31% of its fees: $90.8M of it sits borrowed at a 0.2% rate, which is a position being carried rather than a loan being paid for. And Sonic's book is 98.9% drawn because it is stuck, not because it is busy. Reading those vaults directly, $23.3M is borrowed against $260K of idle liquidity at rates the model has pinned to 99.9% and 299.6%, and every one of them is a vault caught in the Stream Finance collapse where nobody is repaying [7]. Utilization counts a defaulted market and a working one the same way.
The ranking survives removing both. Sonic is 2.5% of Euler's gross deposits and 4.0% of its borrows; Plasma is 11.2% and 18.2%. Taking Sonic out, utilization falls from the published 60.6% to 59.6% and loans to net deposits from 153.6% to 147.5%. Taking Plasma out as well, they fall to 54.6% and 120.2%. Fluid Lending, second on both measures at 53.2% and 113.5%, stays second: Euler's lead narrows from 7.4 points to 1.4 on utilization and from 40.1 points to 6.7 on loans to net, with Sonic costing 1.0 point of the first and Plasma 5.0. The published figures remain the headline, because the peer table is measured the same way for every protocol. The stress test establishes that Euler's position at the top of it is not an artefact of a defaulted chain and a subsidised one.
Two curators run most of the book
Euler publishes its own product registry, the one its interface reads, and joining it to a direct read of the vaults names who configures each market [3]. Sentora curates $221.4M, 67.5% of Ethereum, through two products. K3 Capital curates $285.4M, 74.5% of Monad, across fourteen isolated markets, with Valos second at $86.8M. Between them, two firms account for 71.3% of everything read on-chain.
Curators choose the collateral, the caps and the interest rate model. Anyone can deploy a vault on Euler, so the count of markets measures how open the system is. The count of curators measures who is actually underwriting it, and that number is far smaller.
Where the fees go, and where they do not
Euler's borrowers paid $2.0M in interest in August and the protocol accrued $51.7K of it, a blended take rate of 2.60%. Lenders received $1.78M and the curators who run the vaults took $153.0K. Both August and July are measured the same way across the same 31 days and the same ten chains, so the comparison is like for like: fees rose 2.5% and revenue 2.3%. Those are the smallest movements in this report, and they hide the largest one.
Ethereum's fee base fell 12.5%, from $1.16M to $1.02M, while Monad's rose 91.5%, from $238.6K to $457.0K. Six of the ten chains measured shrank, including Plasma by half and Base by a quarter. The flat protocol total is one chain's growth cancelling six chains' decline, which is the deposit migration described earlier arriving in earnings about a month behind the balances.
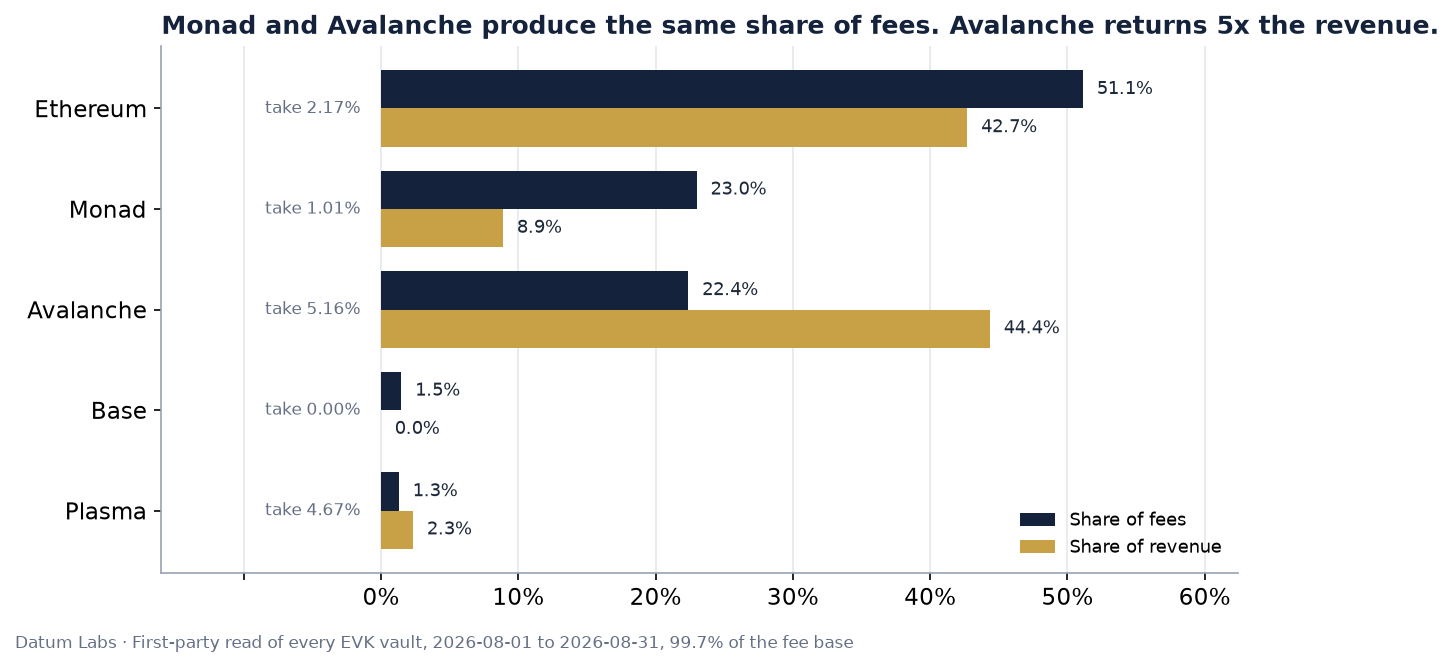
The chains do not contribute in proportion. Ethereum produces 51.1% of fees and 42.7% of revenue at a 2.17% take rate. Monad produces 23.0% of fees and 8.9% of revenue at 1.01%. Avalanche produces 22.4% of fees, almost exactly Monad's share, and 44.4% of revenue at 5.16%. Two chains that look the same size to borrowers hand the protocol amounts that differ fivefold.
The reason was published before it happened. Euler Labs proposed reducing protocol fees to zero on 29 April 2026, arguing that they generate modest revenue while adding a cost layer for curators and integrators, and that growth should come before monetization [10]. Thirteen days later the four-of-eight multisig that administers Euler's ProtocolConfig contract executed it, taking the protocol's share of the interest fee from 50% to zero on 12 May 2026 on Ethereum and on Monad two minutes after [4]. It is the only time that setting has been changed on either chain. Avalanche was never changed and still runs at 50%, which is the whole reason a chain with 22.4% of the fees supplies 44.4% of the revenue. On Ethereum what remains comes from 472 vaults whose curator has never set a payout address, where the protocol collects the entire interest fee by default. All four of Euler's largest Ethereum markets sit outside that, and pay it nothing.
Both surviving sources are narrow enough to name. On Ethereum a single vault, eUSDC-47, is 99.2% of the protocol's current revenue run-rate, borrowing $4.3M at 82.1%. On Avalanche it is eUSDt-3, at 83.0%, a vault that alone produced $403.9K of interest in August, 20.3% of Euler's entire fee base, fully drawn on $16.2M of borrows at 34.97% and still being serviced. Euler's revenue line is two stressed markets, and it moves with their borrow rates rather than with the size of the book.
The fee transfers confirm it from the other end. Euler's vaults emit an event that separates the protocol's cut from the curator's whenever accrued fees are realised, and reading those transfers directly on Ethereum, the protocol's share ran between 50% and 69% from January to May. From June it is 0.0%, in every month including August. So the $51.7K above is what accrued to the protocol, not what reached it: on Ethereum none of it did, and a further $107.7K sits accrued and unconverted across four vaults.
How these figures were derived, and what is missing. DefiLlama's Euler fee adapter stopped publishing after 22 August, so the entire fee family here is rebuilt from Euler's own contracts rather than taken from a feed [6]. Every vault the factory has ever deployed is enumerated and read at each UTC midnight block, and interest is computed two mathematically independent ways: from the change in each vault's share price, which is the method the aggregator uses, and from the change in its interestAccumulator, which is the index borrower debt is stored against. The two agree per chain between 0.995 and 1.046. Where a chain has no public archive node, Monad being the only one, the same accumulator arithmetic is rebuilt from VaultStatus events instead, and that route was validated by running it on Ethereum against the archive answer first.
Three things are disclosed rather than smoothed over. $1.36M of interest is excluded as uncollectible: it accrued on Euler's Sonic vaults caught in the Stream Finance collapse, which sit at 100% utilisation with zero cash while the rate model holds their borrow rates at 99.91% and 299.63% [7]. The debt index compounds regardless, so both methods agree on that figure and neither cross-check can flag it; it is excluded on judgement, and the equivalent July figure was $1.25M. Three chains are excluded as unverified, Unichain, Linea and BOB, where the two methods diverged past the tolerance; together they are 0.28% of the fee base. What remains covers 99.72% of the chain split DefiLlama itself publishes for August.
Measured this way, the published figures are too high. DefiLlama overstates Euler's fees by 14.5% and its revenue by 38.5%, because its adapter multiplies each vault's per-share growth by total assets where the correct multiplier is total shares, which carries a vault's entire accumulated appreciation as a single day of interest. Compared on the days both cover, their implied take rate is 3.18% against an actual 2.63%. Blockworks Research, which measures the protocol and curator margin together rather than the protocol's own share, reports $365.1K for August against the $204.8K of combined protocol and curator fees found here; the difference is almost exactly the Stream Finance accrual, and adding it back brings the two within 8% [5].
What reaches the token is shorter still, and it was switched off deliberately. DefiLlama attributes holder revenue to buy-back auctions on Euler's FeeFlow contract, and reading that contract directly on Ethereum, the last purchase settled on 11 April 2026 for 19,714.91 EUL. It has recorded no events in the 142 days since [9]. Cumulative buybacks stand at $3.2M against a peak month of $713K in October 2025. The auctions were paused by proposal in November 2025, because the Stream Finance losses left bidders unable to withdraw the assets needed to buy EUL and left some fee shares as claims on vaults Stream had made unsellable; those shares accrue to the DAO treasury instead [11]. The April proposal then holds Fee Flow paused for as long as protocol fees are zero. EUL value accrual on the path the aggregator tracks is therefore gated on a future proposal to reintroduce fees, not on trading activity.
Where the month leaves Euler
August was a good month for lending and a weak one for Euler. Revenue edged 2.3% ahead of July, Monad kept compounding, and the protocol held the most intensively lent book in the sector on both measures. Against that, growth came in a point below the sector median, the part of it that can be measured precisely turns out to be collateral repricing rather than new capital, the loan book shrank while deposits rose, the largest and fastest-growing deployment returns a fifth of the margin Avalanche does on almost the same fee base, and the token's buyback mechanism has been paused by proposal for over four months.
The tension is between intensity and scale. Euler's design does more with each dollar than anything else in lending, and it is applied to the smallest book of the ten. The same looping that produces a 153.6% ratio means the free liquidity behind it is thin, with two chains above 98% utilization and four Ethereum vaults holding two thirds of that chain. Efficiency of this kind is a genuine engineering result and a concentration of risk in the same measurement.
September poses concrete questions. Whether Monad's collateral starts being borrowed against, which is what would turn a 36% utilization warehouse into a lending market. Whether Ethereum's decline, 52% since May, finds a floor. Whether the blended take rate keeps falling as Monad grows. And whether the DAO moves to reintroduce fees, which is the stated condition for restarting the buyback.
Methodology
Every figure in this report updates live on the Datum Labs Euler terminal [1].
Sources. Deposits and loans come from DefiLlama's public API, slug euler for the parent and euler-v2 for the product [2], and prices from its coins API. Product and curator names come from Euler's own public label registry [3], which carries labels only, no balances and no financials. Fees and revenue are not taken from DefiLlama. They are rebuilt from Euler's contracts, reading every vault the factory has deployed at each UTC midnight block across ten chains, with the protocol fee share read from ProtocolConfig [4] and realised splits from ConvertFees events. Euler publishes no financials of its own: its app API returns 403 and data.euler.finance resolves to an error page on every path.
- Deposits are gross, meaning idle deposits plus active loans. DefiLlama's headline TVL is already net of borrows, so gross adds the per-chain borrowed series, and only the per-chain series, never the bare aggregate alongside them.
- Two intensity measures appear, and always together. Capital efficiency is active loans over net deposits and is unbounded; utilization is active loans over gross deposits and is capped at 100%. Euler is first of ten on both.
- The price-neutral test revalues end-of-month token quantities at 1 August prices and compares them against the same quantities at 31 August prices, so nothing is assumed about how composition changed within the month. Assets with no price at either date are excluded rather than estimated.
- Every series is collapsed to its 00:00:00 UTC close, because DefiLlama appends one live intraday point per series and its per-chain series are not timestamp-aligned.
- Stock metrics are monthly averages, flows are monthly totals. July and August both have 31 days.
- The parent slug is headlined, and it agrees with the sum of its children to 0.00% in every month back to August 2025, because there is one live product.
Cross-checks. All 1,017 Euler Vault Kit vaults on Ethereum (883) and Monad (134) were read directly for cash() and totalBorrows() with zero call failures, covering $704.9M of $925.4M, or 76.2% [8]. Measured at the same instant, that read differs from DefiLlama by 0.4% on Monad and 2.8% on Ethereum. Every headline figure was then recomputed from the raw API by a second script written independently of the data pipeline, and all 16 matched to 0.00%; that pass also confirmed the sector median is the true median of ten values (7.01%) rather than the upper of the two middle values (7.14%). Against Blockworks Research, deposits and loans on 27 August agree to within 2.3% and 1.5% [5].
Gaps. The price-neutral result covers Ethereum and Monad only, 76.2% of the book, and is not scaled to the rest. Four assets holding $43.0M have no usable price history and are excluded from it; three are dollar-denominated and would not have repriced, so the measured repricing share is slightly overstated. On-chain quantities were read on 2 September, so composition shares carry a two-day offset; levels come from the dated series rather than from that read. No per-asset claim comes from DefiLlama's per-protocol token breakdown, which disagreed with per-market data by up to five times on a sister protocol; composition comes from the vault read instead. Curator attribution uses Euler's own registry, which accounts for 85.7% of Ethereum's book and 100% of Monad's, and the unattributed remainder is left unattributed rather than assigned. The fee change was proposed on Euler's forum and executed by the administering multisig; no Snapshot vote was found in the window, and the forum topic drew no replies. EulerSwap is excluded from this edition.
References
- Datum Labs, "Euler Research Terminal," live dashboard. https://datumlab.xyz/euler-terminal
- DefiLlama, Euler V2 protocol data. https://defillama.com/protocol/euler-v2
- Euler Finance, product and entity label registry. https://labels.euler.finance/master/1/products.json
- Etherscan, Euler
ProtocolConfig0x4cD6BF1D183264c02Be7748Cb5cd3A47d013351b,SetProtocolFeeShare5000 to 0, 12 May 2026 20:53 UTC, executed by the four-of-eight Safe0xcAD001c30E96765aC90307669d578219D4fb1DCe. https://etherscan.io/tx/0xc8824b776b2488d57f914d7ba992aae6d91fc27ff9c0dac6021b818b0904b37e - Blockworks Research, Euler financials dashboard, August 2026 revenue $365,149. https://app.blockworksresearch.com/analytics/euler
- DefiLlama, dimension-adapters, Euler fee adapter methodology. https://github.com/DefiLlama/dimension-adapters/blob/master/fees/euler/index.ts
- DefiLlama, dimension-adapters, excluded vault list, Sonic entries annotated as Stream Finance related. https://github.com/DefiLlama/dimension-adapters/blob/master/helpers/lists.ts
- Euler Finance, protocol documentation, Euler Vault Kit and Ethereum Vault Connector. https://docs.euler.finance
- Etherscan, FeeFlow controller
0xFcd3Db06EA814eB21C84304fC7F90798C00D1e32, last buy transaction 11 April 2026. https://etherscan.io/tx/0x68429b6656d473be726ddf1c7b205ee011f67d846c8a128afd821d3abb32bc56 - Euler DAO forum, EulerLabs, "[Proposal] Reduce Euler Protocol Fees to Zero," 29 April 2026. https://forum.euler.finance/t/proposal-reduce-euler-protocol-fees-to-zero/1835
- Euler DAO forum, EulerLabs, "[Proposal] Temporarily disable FeeFlow auctions," 5 November 2025. https://forum.euler.finance/t/proposal-temporarily-disable-feeflow-auctions/1702
Data: DefiLlama public API for deposits and loans, a first-party read of 1,017 Euler EVK vaults covering 76.2% of the protocol, and a first-party rebuild of fees and revenue across ten chains covering 99.7% of the fee base. Every figure updates live at datumlab.xyz/euler-terminal.
For informational purposes only. Not investment advice.