

Fluid's deposits rose for a second consecutive month in August. So did every other major lending protocol, and Fluid finished fifth of ten at the sector median. Once the peer set is in view, the more interesting findings are the ones the headline number hides: a capital efficiency decline that reverses under a price-neutral test, a white-label deployment that has roughly doubled the fee base without reaching Fluid's revenue line, and an exchange business still contracting in every currency it can be measured in.
Figures cover 1 to 31 August 2026, compared against the 31 days of July. Methodology and named gaps are at the end.
Key takeaways
- Gross deposits averaged $3.34B, up 4.5% on July and 17.2% year on year. Active loans averaged $1.66B, up 4.4%. The book closed the month at $3.59B, 13.7% above where it opened.
- The growth was market-wide. All ten major lending protocols grew. Sector median +7.0%; Fluid Lending +7.1%, fifth of ten. Aggregate deposits across the group rose 11.3%, from $54.66B to $60.84B.
- Dollar figures overstate deposit growth. ETH rose 31.1%, BTC 24.2% and SOL 41.9% over the same window, so part of every lender's increase is collateral being marked higher.
- Capital efficiency fell from 103% to 98%, and the decline reverses under test. It came from Jupiter Lend, whose supply is 43.2% Solana-linked. Holding prices constant, Jupiter Lend's efficiency rose from 94.1% to 99.4%. Fluid's own Ethereum book held at 120%.
- Jupiter Lend's markets now generate 49.6% of the fee base the Fluid stack touches, $3.63M against Fluid's own $3.68M, none of which is separable in Fluid's reported revenue.
- Fluid's own revenue reached $514K, up 9.3%, on a 14.0% take rate that rose from 13.0% in July.
- DEX volume fell 15.0% in dollars and 14.7% denominated in ETH, confirming a real decline rather than a currency effect. It is 87.9% below August last year.
- Fluid is no longer the second-largest DEX on Ethereum. On 30-day volume Curve sits ahead, $3.16B against $2.77B, placing Fluid third with each protocol's versions combined and fourth as DefiLlama lists them.
- Smart Vaults reached $206.9M of trading volume in three weeks from a standing start, with 65% of it in the final seven days.
The number that means less than it looks
Gross deposits averaged $3.34B in August, up 4.5% on July and 17.2% on the same month last year. Active loans averaged $1.66B, up 4.4%. From the first of the month to the last, the book climbed from $3.16B to $3.59B, a 13.7% gain. Read alone, that is a protocol pulling clear of a long drawdown.
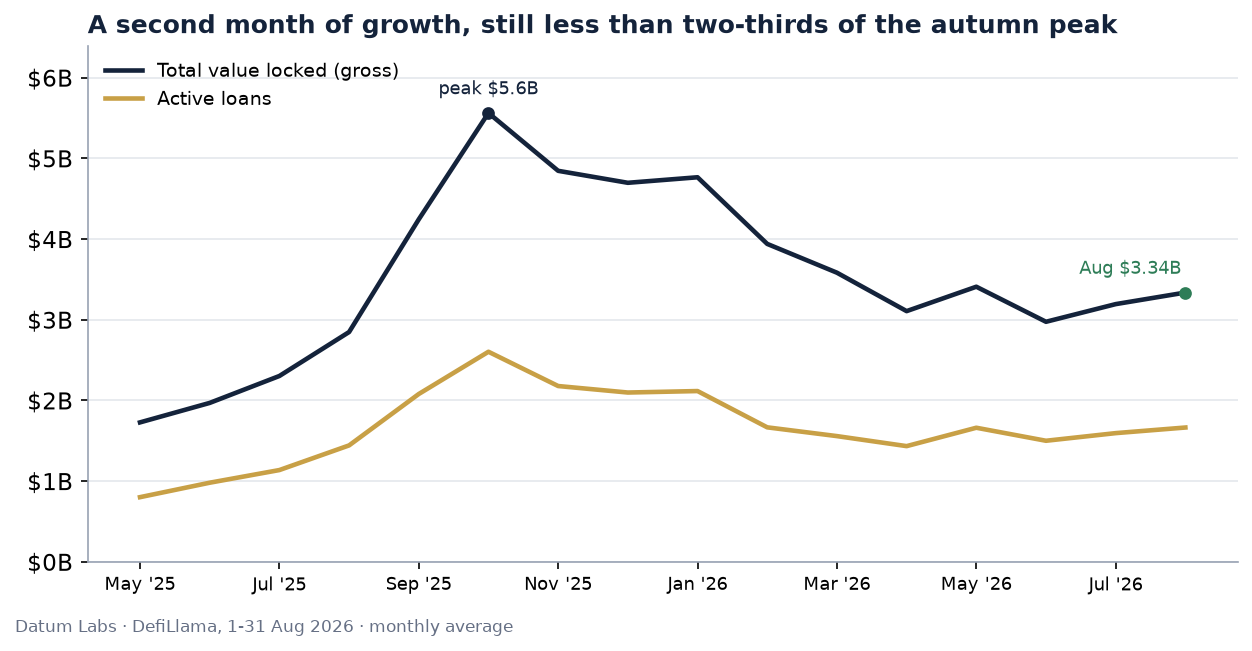
The year gives it scale. Deposits opened 2026 at $4.77B, fell to a $2.97B trough in June, and August's $3.34B stands 12.2% above that trough and 30.0% below where the year began. Two months of growth have retraced part of a longer slide.
The more useful question is whether any of it says something about Fluid specifically.
Everyone grew
It does not. Measured identically across the ten largest lending protocols over the same window and on the same gross basis, every one of them grew in August.
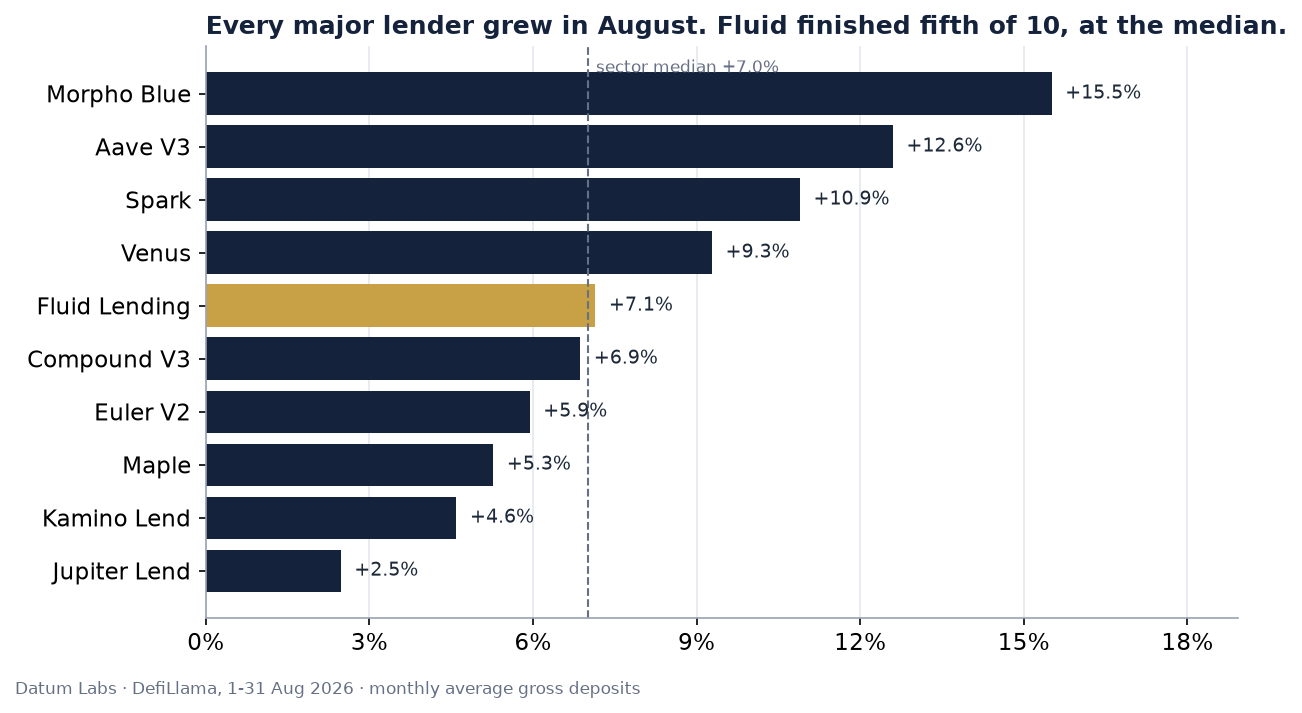
Sector median growth was +7.0%. Fluid Lending grew +7.1%, ranking fifth of ten, a tenth of a point above the middle. Aggregate deposits across the group rose from $54.66B to $60.84B, up 11.3%, with Morpho Blue (+15.5%) and Aave V3 (+12.6%) capturing the larger share.
A month in which everything rises describes conditions, not competitiveness. Jupiter Lend is worth isolating: as the largest single deployment in the Fluid ecosystem, it grew +2.5%, the weakest reading in the peer set and 4.5 points below the median.
What a dollar measured
The denominator deserves scrutiny too.
| Asset | 1 Aug | 31 Aug | Change |
|---|---|---|---|
| Ethereum | $1,865 | $2,445 | +31.1% |
| Bitcoin | $63,013 | $78,282 | +24.2% |
| Solana | $73 | $104 | +41.9% |
Deposits are denominated in dollars, and in August the underlying assets appreciated by between a quarter and over two-fifths. Single-digit dollar growth against that backdrop does not establish that new capital arrived; some portion is existing capital marked higher. The effect scales with collateral volatility and disappears where collateral is stablecoins.
Jupiter Lend illustrates it sharply. 43.2% of its supply is Solana-linked, SOL rose 41.9%, and its dollar deposits rose 2.5%. A book carrying that much volatile collateral cannot rise 2.5% in dollars through a 42% rally without contracting in real terms. Fluid's own Ethereum markets are predominantly stablecoins and tokenized real-world assets, so their dollar figure sits close to their real size.
Where a book's composition can be measured, the two effects separate cleanly. The next section does exactly that.
The efficiency decline that reverses under test
Capital efficiency, active loans divided by net deposits, is Fluid's strongest claim against larger competitors. In August it fell from 103% to 98%, as deposits grew 16.4% against loan growth of 10.8%.
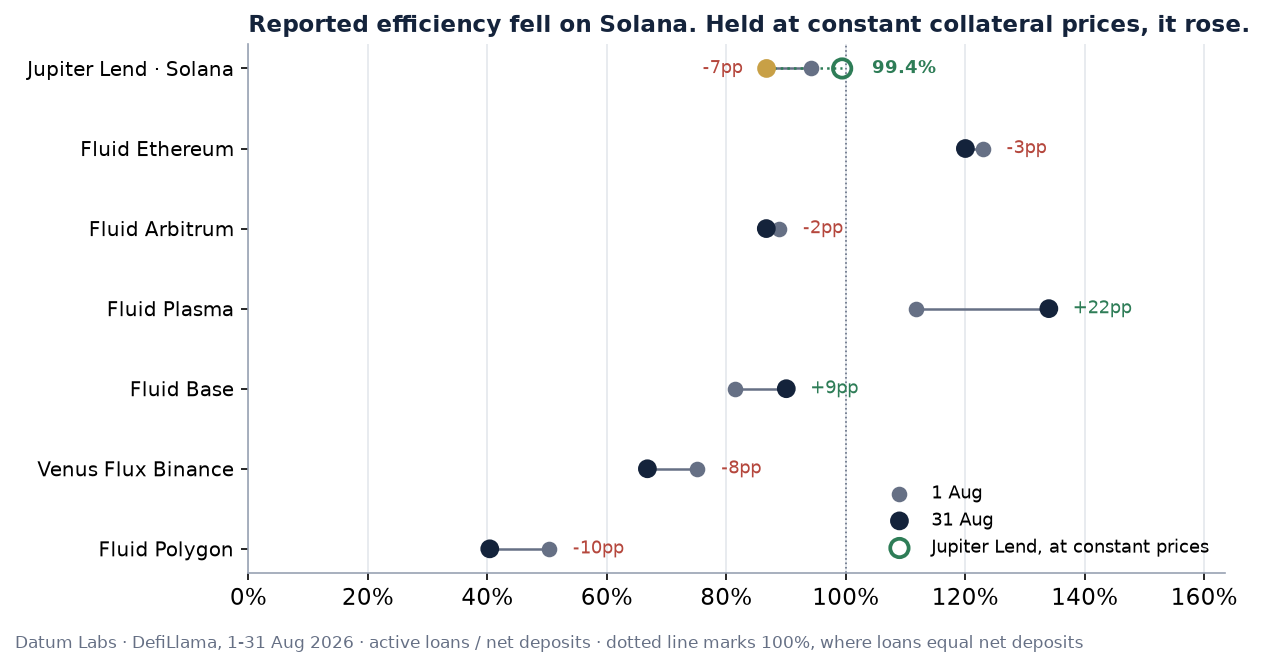
The decomposition locates the move. Jupiter Lend fell from 94% to 87%, absorbing $252.3M of new deposits against a smaller rise in borrowing. Fluid's own Ethereum book held at 120%, down three points and second only to Euler V2 across the peer set. Arbitrum slipped two points, while Plasma improved twenty-two.
Whether that reflects weaker borrowing or the same repricing that flattered the deposit line can be settled rather than hedged. Jupiter Lend's supply is 43.2% Solana-linked against 56.8% stablecoins and tokenized assets, measured per market, and its debt legs are predominantly stablecoins. Deflating the Solana-linked share of end-August collateral to 1 August prices removes $137.3M of pure repricing from the denominator:
| Basis | 1 Aug | 31 Aug | Change |
|---|---|---|---|
| As reported (USD) | 94.1% | 86.7% | -7.4pp |
| Price-neutral | 94.1% | 99.4% | +5.3pp |
Jupiter Lend's capital efficiency improved in August. The reported decline is collateral marked higher against stablecoin debt that did not move. The attribution splits as 12.7 points of price effect against 5.3 points of genuine behaviour. The conclusion is robust to the debt-side assumption: even if a fifth of Jupiter's debt were also Solana-linked, price-neutral efficiency lands at 93.6%, flat rather than down.
Two implications follow. Headline efficiency for any lender holding volatile collateral is partly a price index and will move in a rally for reasons unrelated to borrowing. And Fluid's shared-liquidity design did not soften; on a like-for-like basis it did not soften at all.
Reach, and what it costs
Fluid's own markets earned $514K in August, up 9.3% on July, on $3.68M of fees. The take rate rose from 13.0% to 14.0%, so what Fluid kept grew faster than the fee base beneath it.
The larger number sits outside that line. Jupiter Lend's markets generated $3.63M of fees in August, within 2% of Fluid's own and 49.6% of the two combined. On the fee base alone, the Fluid stack now earns interest on roughly twice the borrowing that Fluid's own deployments carry.
Almost none of that reaches Fluid's reported revenue. Interest paid by Jupiter Lend's borrowers is divided between lenders, Jupiter and Fluid, and DefiLlama books Fluid's share inside supply-side revenue, where it cannot be separated from lender interest. The 5.0% that Jupiter Lend retains as protocol revenue, $182K in August, goes to Jupiter and JUP token holders under the 50/50 arrangement described in Fluid's launch announcement [3]. Fluid's cut is real and is not measurable from public data.
That is the shape of the white-label trade. It roughly doubles the interest the technology earns on, and it moves the resulting margin into a line no public source separates. Whether the trade is a good one turns on figures neither Fluid nor Jupiter publishes.
The exchange business
Trading volume totalled $2.78B, down 15.0% on July and 87.9% below August last year.
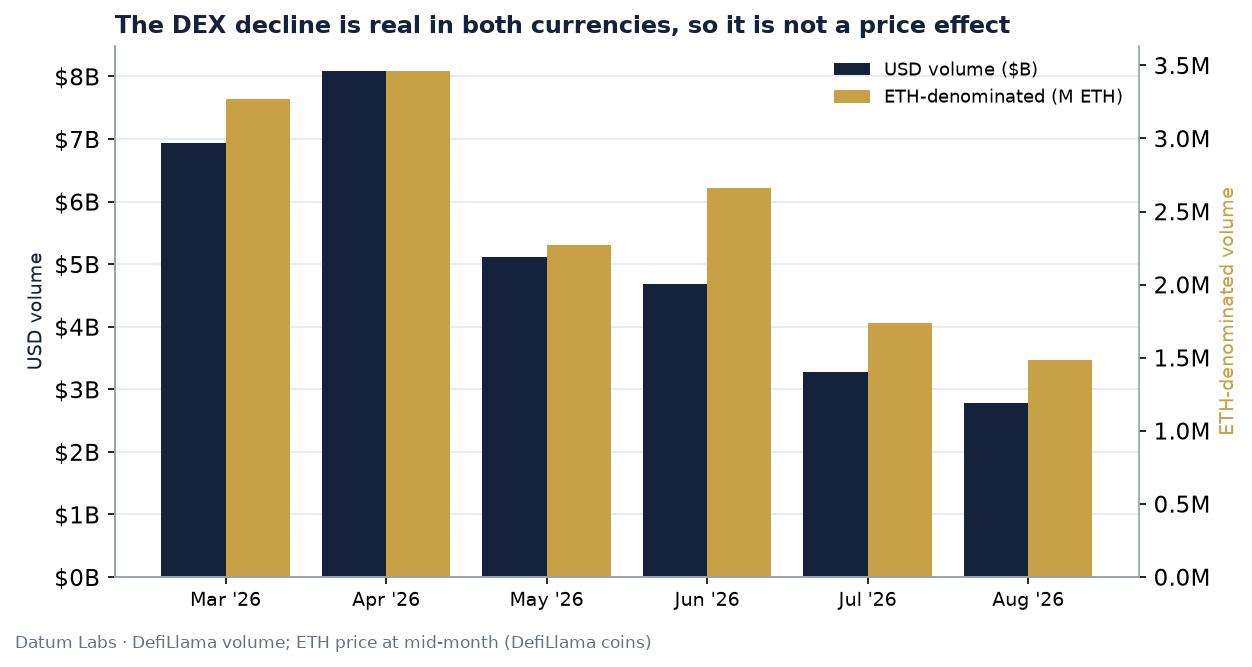
A dollar-denominated decline during a rally invites the objection that it is a currency effect. It is not. Denominated in ETH, volume fell 14.7%, within half a point of the dollar reading. Since March the DEX has contracted from 3.27M ETH of monthly volume to 1.48M, roughly 55% in ETH terms.
June demonstrates why the unit matters: volume fell 8.5% in dollars but rose 17.2% in ETH, because ETH declined that month. The denominator changed the sign of the reading. August's decline survives that test in both directions.
The decline has now cost Fluid a position it held for most of the year. On 30-day Ethereum volume, Curve DEX sits ahead of Fluid DEX, $3.16B against $2.77B. Combining each protocol's versions gives Uniswap $21.62B, Curve $3.16B and Fluid $2.77B, which places Fluid third; taken exactly as DefiLlama lists them, with Uniswap's V4 and V3 counted separately, Fluid is fourth. The ordering is the same on a 24-hour window, and over seven days Fluid sits fourth behind a newer venue as well. Fluid ranked second on this measure through the second quarter and Token Terminal's Q2 report recorded it [2]. A business whose volume has fallen 87.9% in a year does not hold its ranking indefinitely, and this is the month it moved.
The one line growing
Jupiter Lend v2 launched on 10 August. Fluid's announcement described it as "built entirely on Fluid's infrastructure" and confirmed the 50/50 revenue share [3]. Its Smart Vaults allow a deposit to serve as DEX liquidity while earning lending yield, applying Fluid's shared-liquidity design on Solana.
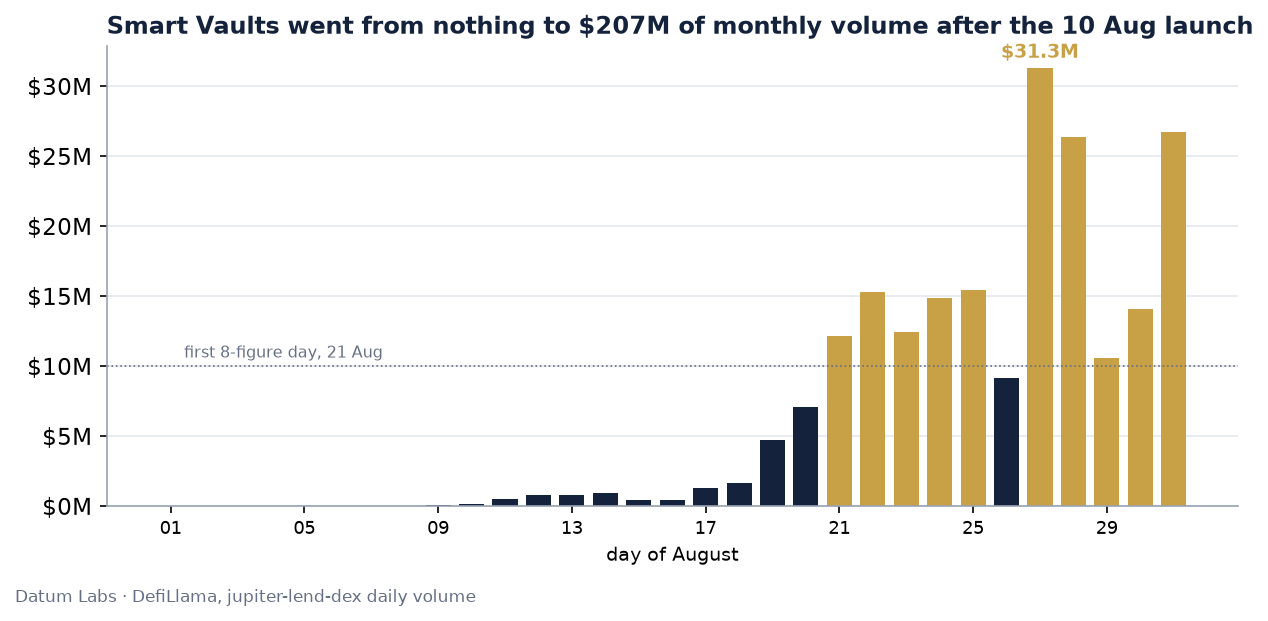
Smart Vaults recorded $206.9M of trading volume in three weeks, crossing an eight-figure day on 21 August at $12.1M and peaking at $31.3M on the 27th. Volume is a flow rather than a stock, so none of it is price appreciation. The trajectory matters more than the total: $133.6M, roughly 65%, arrived in the final seven days, and the last four days of the month all cleared $10M.
Scale keeps the interpretation honest. At $206.9M, Smart Vaults are 7.4% of Fluid's own DEX volume and do not offset the decline on Ethereum. What they demonstrate is that the same design producing falling volume in one venue is producing rapidly rising volume in another.
Where the month leaves Fluid
August was a good month for lending and an ordinary one for Fluid. Deposits and loans rose for a second consecutive month, revenue outpaced deposit growth, the core Ethereum book held an efficiency almost every competitor sits far below, and on a price-neutral basis the Solana deployment improved rather than deteriorated. Against that, growth landed at the sector median, part of it was collateral repricing rather than new capital, the exchange business declined again in every currency, and the ecosystem's largest deployment grew the slowest in the peer group while returning the least margin per dollar of fees.
The tension sits between two halves of one design. On Ethereum, where Fluid's shared liquidity has run longest, deposits grow while trading volume falls. On Solana, through Jupiter, the same mechanism produced $206.9M of volume from nothing in three weeks while the deposit book underperformed its peers and returned a third of the take rate. The architecture is not the variable. The venue, the flow that reaches it, and the commercial terms attached to it are.
September poses concrete questions. Whether Smart Vault volume holds its late-August run rate once launch attention fades. Whether Fluid's own DEX finds a floor in ETH terms as well as dollars. Whether the blended take rate keeps falling as Solana grows into a larger share of the book. And whether a third month of growth turns into share gains rather than another median.
Methodology
Every figure in this report updates live on the Datum Labs Fluid terminal [1].
Sources. DefiLlama's public API for protocol metrics, prices and per-market composition [5]; defillama.com/dexs/chains/ethereum for the Ethereum DEX ranking, measured on 30-day volume as of 3 September; Fluid's own API for the cross-check [6]; Token Terminal's Q2 2026 report as the benchmark [2].
- Deposits are gross, meaning idle deposits plus active loans. DefiLlama's headline TVL is already net of borrows, so gross adds the per-chain borrowed series.
- Capital efficiency is active loans divided by net deposits, measured per deployment so Fluid and Jupiter Lend compare like for like.
- Two deposit figures appear. The peer table measures
fluid-lendingalone (+7.1%); the headline combines it with Jupiter Lend (+4.5%). Each is labelled where it is used. - Revenue is Fluid's own, from the
fluidentry. Jupiter Lend's revenue is not added to it. DefiLlama defines that line as interest paid to Jupiter and JUP token holders, and books Fluid's share of the same interest as supply-side revenue, where it cannot be separated. - The price-neutral test holds Jupiter Lend's Solana-linked collateral, 43.2% of supply at month end, at 1 August prices. Sensitivity to the debt-side assumption is reported in the text.
- Stock metrics are monthly averages, flows are monthly totals. July and August both have 31 days, so no day-count adjustment applies.
Cross-checks. Fluid's first-party API reproduces 86.8% of DefiLlama's borrow figure, the shortfall being smart-debt vaults that carry no USD field. DefiLlama's jupiter-lend-dex entry was rebuilt directly against Solana and matched to 0.03%, which settles the Smart Vault supply question: Jupiter's interface counts collateral across every Smart Vault, DefiLlama counts only collateral that is live AMM liquidity.
Fluid's own August recap. Three of its four figures reconcile: cumulative DEX volume "$228B+" against $229.79B, Jupiter Lend "$2B" against $2.01B, and "$4B market size" against $4.09B on a whole-ecosystem basis. The fourth does not. "$18.1B trading volume for the first semester of 2026" is Token Terminal's second-quarter figure [2]; the first half of 2026 sums to $45.90B.
Gaps. No August Smart Vault supply figure is published, because decomposing a past date needs an archive node; the volume series carries that section instead. No per-asset claim comes from DefiLlama's per-protocol token breakdown, which disagrees with per-market data by up to five times. DefiLlama's fee figure runs roughly double Token Terminal's on a different accounting basis, so retained revenue carries the financial analysis. Fluid's DEX v2 and its own Solana DEX could not be confirmed as shipped against a primary source [4], and neither is treated as launched.
References
- Datum Labs, "Fluid Research Terminal," live dashboard. https://datumlab.xyz/fluid-terminal
- Token Terminal, "Fluid Q2 2026 Report," August 2026. https://tokenterminal.com/explorer/projects/instadapp
- Fluid, "Jupiter Lend v2 Is Live: Powered by Fluid," 10 August 2026. https://fluid.io/blog/general-jupiter-lend-v2-is-live-powered-by-fluid
- Fluid, "Fluid H1 2026 Recap," 5 August 2026. https://fluid.io/blog/general-fluid-h1-2026-recap
- DefiLlama, protocol and DEX data. https://defillama.com/protocol/fluid-lending
- Fluid, first-party API. https://api.fluid.instadapp.io/v2/1/vaults
Data: DefiLlama public API, yields.llama.fi per-market data, and Fluid's first-party API, reconciled to Token Terminal's Fluid Q2 2026 report. Every figure updates live at datumlab.xyz/fluid-terminal.
For informational purposes only. Not investment advice.