

Spark's Liquidity Layer is a $2.72B business that, on the last day of August, was earning 6 basis points. Six. On that same day SparkLend was holding record wstETH collateral, deposits were up 10.9% on July, and Spark had just outgrown seven of the nine other major lenders. Both things are true of the same month, and this report is about how.
The short version: the growth belonged to the market and the margin belonged to Spark. ETH rose 31.1% in August and 75.8% of SparkLend's book is ETH or BTC linked, so the deposit figure rose with the price. Meanwhile the rate Sky charges Spark for capital went up while what that capital earned went down, and the family kept 26.0% less than in July. Strip out the payment Sky makes to Spark and Spark's own products kept $400,255 on a book approaching $7B. If you hold SPK, vote on Sky's forum, or benchmark lenders for a living, the number to carry into September is that spread.
Key takeaways
- Family gross deposits averaged $7.01B, up 10.9% on July. The family is still 22.6% smaller than a year ago, so this is recovery from a low base.
- SparkLend grew 10.7%, third of ten major lenders, against a sector median of 7.0%. Every major lender grew.
- Most of that dollar growth is collateral repricing. ETH rose 31.1% and wstETH 31.5% over the month, and 75.8% of SparkLend's supply is ETH or BTC linked.
- Capital efficiency reads 46.3%, down 2.8 points. At constant prices it rose 1.6 points. The apparent decline is entirely a denominator effect.
- Family net revenue fell 26.0% to $1.24M while gross yield fell only 4.1%. The gap is margin, not volume.
- The Liquidity Layer's take rate halved, 6.7% to 3.8%. It earned $8.02M and paid $7.72M for the capital, keeping $301,520.
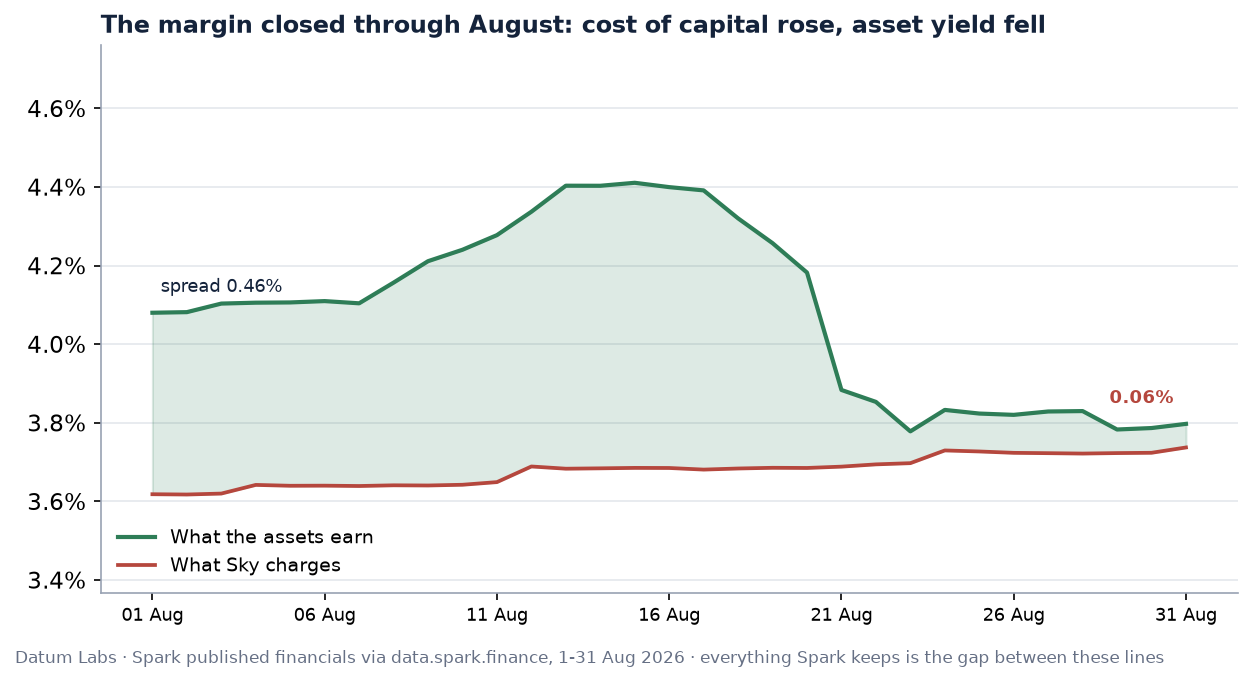
- Spark's cost of capital rose while its asset yield fell. The spread averaged 0.560% over the first half of August and 0.266% over the second, closing the month at 0.060%.
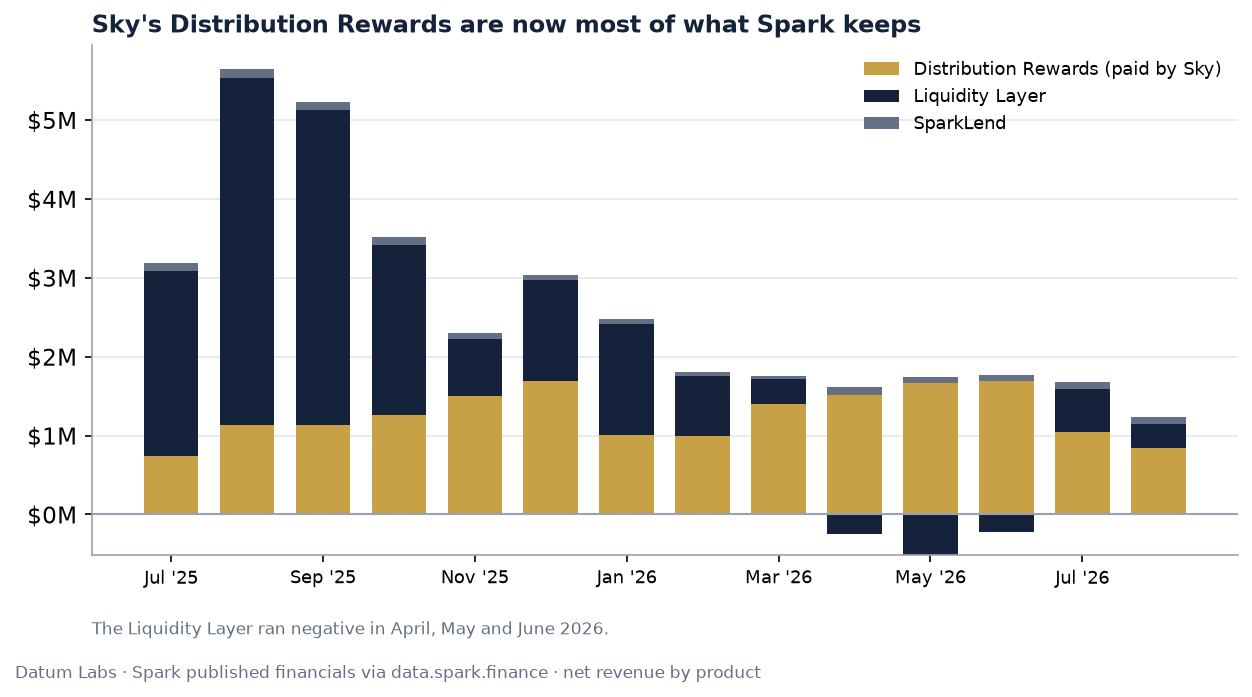
- Distribution Rewards were 68% of family net revenue, and they fell 19.0% month on month. What Spark's own products earned, net, was $400,255.
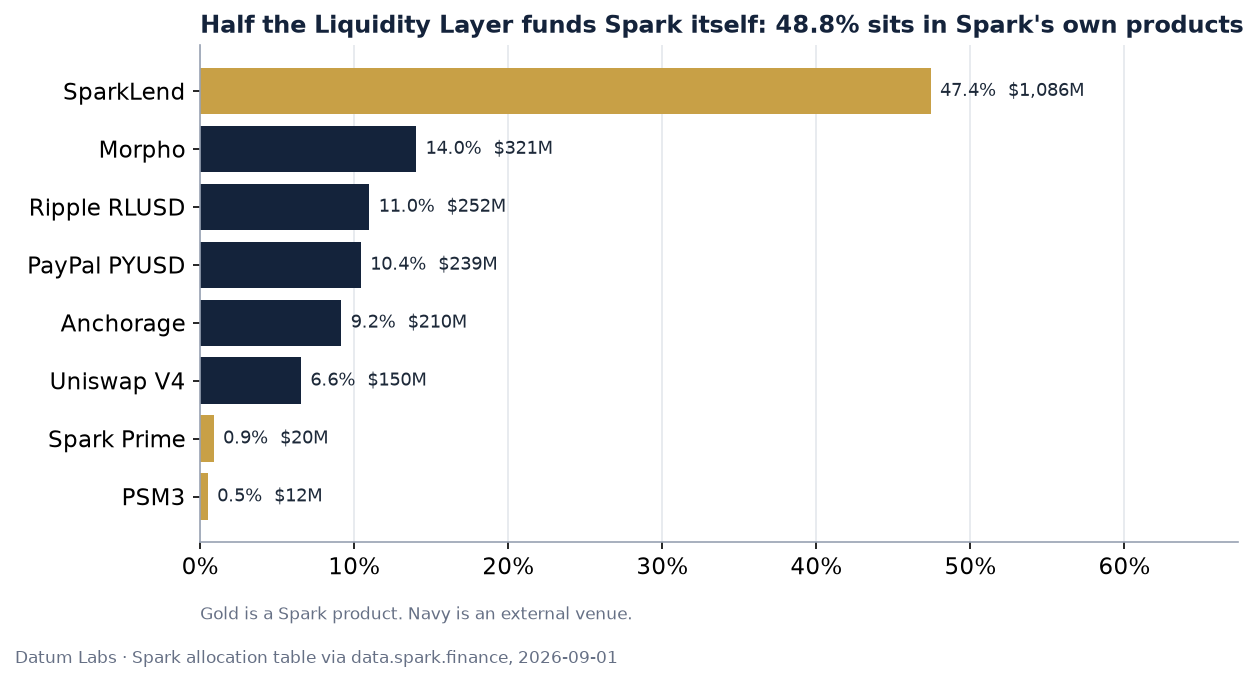
- SparkLend is the single largest destination for the Liquidity Layer's capital at 47.4%. Counting Spark's other products, 48.8% of the allocator's book funds Spark itself.
Everyone grew, and Spark grew faster than most
Start with the level. Family gross deposits averaged $7.01B across August, up 10.9% on July. Against a year ago the family is still 22.6% smaller, so read August as recovery from a low base rather than a return to prior scale.
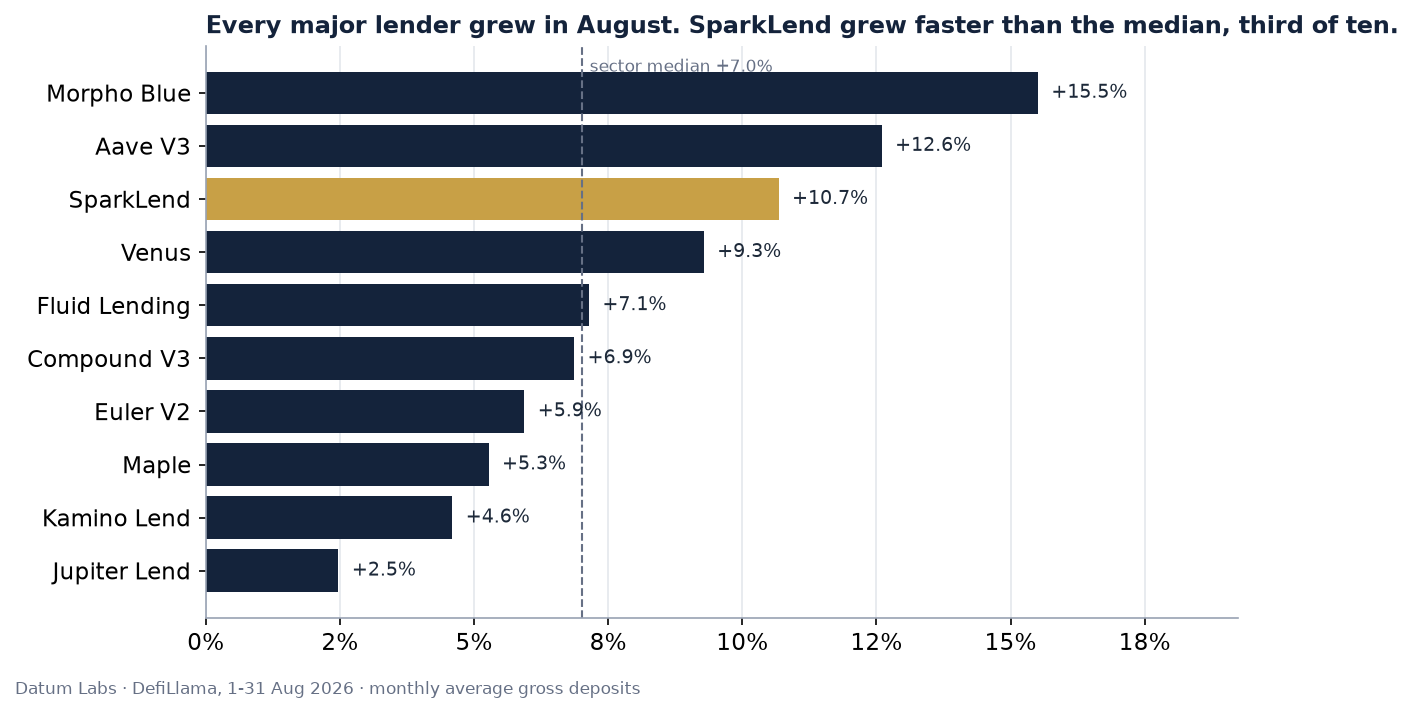
Now put that next to the peers. Measured the same way across the ten largest lending protocols, gross basis, same window, every one grew. The sector median was +7.0% and aggregate deposits rose 11.3%.
SparkLend grew +10.7%, third of ten and 3.7 points clear of the median, behind Morpho Blue (+15.5%) and Aave V3 (+12.6%). Beating the median in a month when nothing fell is a real result. It is also worth separating from the market conditions that produced most of the level, which is where the next section goes.
Spark's own recap for the month reports two collateral records, WBTC supply passing 3,000 units on 1 August and wstETH supply passing $3B on 21 August [4]. Both check out against the reserve data.
What a dollar measured
Deposit figures are counted in dollars and held in tokens, and that is easy to forget. When the tokens go up, the dollar figure goes up, and not one new deposit has to arrive for that to happen.
| Asset | 1 Aug | 31 Aug | Change |
|---|---|---|---|
| wstETH | $2,311 | $3,039 | +31.5% |
| ETH | $1,865 | $2,445 | +31.1% |
| BTC | $63,013 | $78,282 | +24.2% |
75.8% of SparkLend's $6.45B supply is ETH or BTC linked. Set a 10.7% rise in dollar deposits against collateral moves of that size and the move in tokens is a good deal smaller than it looks.
The same effect runs through capital efficiency, and there it runs the wrong way. Active loans divided by net deposits reads 46.3% at month end against 49.1% at the start, a fall of 2.8 points. Hold end-of-month token quantities at start-of-month prices and the same measure rises 1.6 points. Collateral repriced upward faster than borrowing against it grew, so the ratio fell while the book itself became modestly more productive. The reported decline is a denominator effect and nothing more.
One independent check before moving on. Reserve supply of $6.45B less borrows of $2.02B gives $4.42B, against the $4.4B SparkLend TVL Spark published for the same date [4]. The on-chain read and the protocol's own figure agree.
The earnings went the other way
None of that asset growth reached the bottom line.
| July | August | Change | |
|---|---|---|---|
| Family gross yield | $9.34M | $8.96M | -4.1% |
| Family net revenue | $1.68M | $1.24M | -26.0% |
| Liquidity Layer net | $546,266 | $301,520 | -44.8% |
| Liquidity Layer take rate | 6.7% | 3.8% | -2.9pp |
Gross yield fell 4.1%. Net revenue fell 26.0%. The distance between those two numbers is the whole story of August, and it is a margin story rather than a volume story.
The Liquidity Layer produces 89.5% of the family's reported gross yield and contributed 24% of what the family kept. It earned $8.02M and paid $7.72M for the capital that earned it.
One caution on that 89.5%. Spark reports gross yield as what accrues to Spark before Spark's own funding costs, and the Liquidity Layer is the only product that carries such a cost. SparkLend's line is already net of the interest paid out to its suppliers, because that interest never belonged to Spark. So 89.5% is the Liquidity Layer's share of what reaches Spark, not its share of the economic activity the family intermediates.
The margin, and where it went
Spark's Liquidity Layer runs on one number. It borrows from Sky, redeploys the money across DeFi, and keeps whatever the deployed assets earn above what Sky charges. Think of a shop that buys wholesale and sells retail: the business is the gap between the two prices and nothing else. In August the wholesale price rose and the retail price fell, in the same month. Below is the gap closing day by day.
| 1 Aug | 31 Aug | |
|---|---|---|
| Asset yield | 4.080% | 3.797% |
| Cost of capital | 3.618% | 3.737% |
| Spread | 0.462% | 0.060% |
The cost of capital rose 12 basis points while the asset yield fell 28. Average each half of the month separately and the spread ran 0.560% through the first half and 0.266% through the second.
Six basis points on $2.72B of assets is an annualised run rate near $1.6M. That is the size of the business at month end, on a book that produced $8.02M of gross yield in August alone.
It also explains why the Liquidity Layer's earnings swing in a way its assets do not. Net revenue is the residual of two much larger numbers, 3.8% of gross in August. A 1% error in measuring either input moves the residual by roughly 27x as much in proportional terms. Read it as a range, never as a point.
Two thirds of what Spark kept came from Sky
Not all of Spark's revenue is earned in the market. Some of it is paid to Spark.
| Product | Net, August | Share of family net |
|---|---|---|
| Distribution Rewards | $843,505 | 68% |
| Liquidity Layer | $301,520 | 24% |
| SparkLend | $96,404 | 8% |
| Curation Fees | $2,331 | 0% |
Distribution Rewards are a payment from Sky under the Agent Framework, accrued on USDS balances that Spark refers and settled as a monthly transfer. They are neither yield the Liquidity Layer generated nor interest SparkLend collected.
Strip them out and Spark's products kept $400,255 across a book approaching $7B. The rewards themselves fell 19.0% month on month, so the largest single component of Spark's revenue is both set outside Spark and currently shrinking.
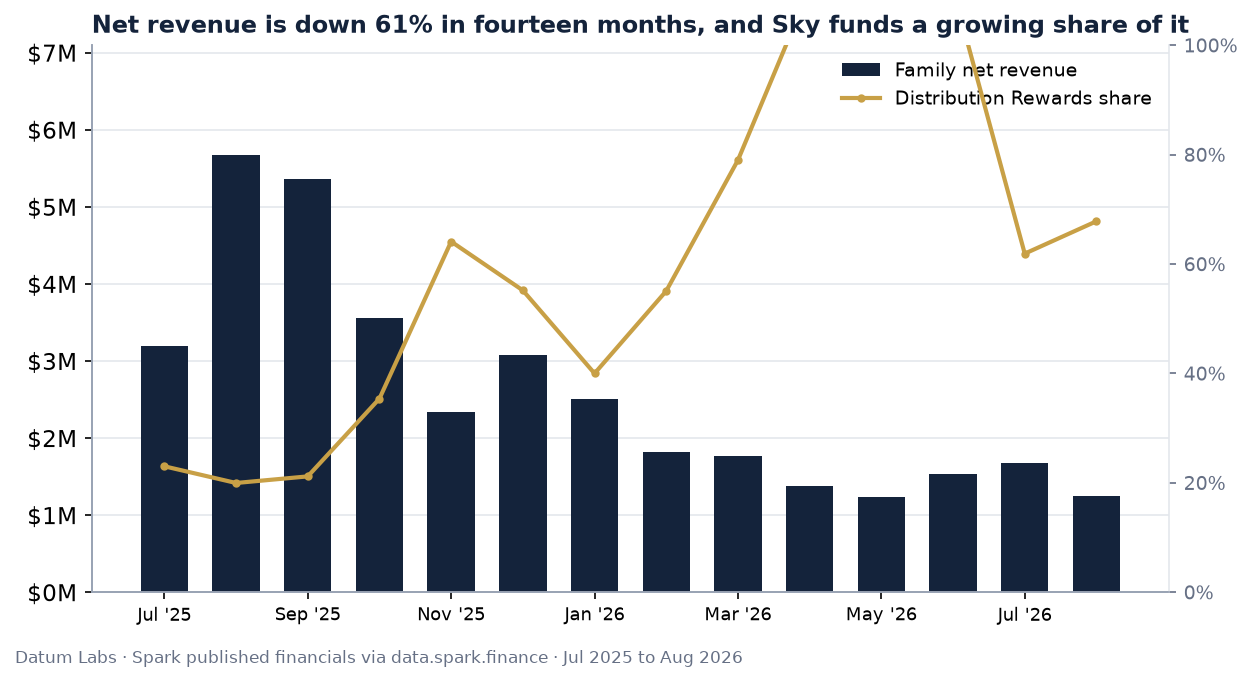
Stretch the series to fourteen months and the direction is hard to miss. Family net revenue has fallen from $3.20M in July 2025 to $1.24M now, a decline of 61%, while Distribution Rewards moved from 23% of net to 68%. The Liquidity Layer ran outright negative in April, May and June 2026 before recovering.
The allocator that mostly funds Spark
Spark describes its Liquidity Layer as deploying Sky's capital across DeFi. Its own allocation table shows where that capital actually sits, and the answer is mostly Spark.
| Venue | Share | USD |
|---|---|---|
| SparkLend | 47.4% | $1.09B |
| Morpho | 14.0% | $321.4M |
| Ripple RLUSD | 11.0% | $251.7M |
| PayPal PYUSD | 10.4% | $239.1M |
| Anchorage | 9.2% | $210.0M |
| Uniswap V4 | 6.6% | $150.1M |
| Spark Prime | 0.9% | $20.3M |
| PSM3 | 0.5% | $11.5M |
SparkLend is the single largest destination, taking 47.4% of a $2.29B book. Add Spark Prime and PSM3 and 48.8% of the allocator's capital is redeployed into Spark's own products against 51.2% external.
This is also why the family figure is smaller than the sum of its parts. Add the three products and you get $9.58B against a de-duplicated family total of $7.76B, an overlap of $1.82B. The child sum overstates the family by 23.5%. Capital counted in the Liquidity Layer and again in SparkLend is the same capital, counted twice.
And it explains the shape of the earnings. Roughly half the allocator's book funds a lending market whose own net take was $96,404 for the month, and the funding cost on that capital is charged in full regardless.
What August says
Spark had a good month for assets and a poor one for earnings, and the two have less to do with each other than they appear to. Deposits rose because collateral repriced and because every lender grew. Earnings fell because the spread between Sky's rate and deployed yield closed to almost nothing. One is the market. The other is the business.
So the question August leaves is not about growth. It is whether a business built on a spread can operate at 6 basis points.
Spark answers that on its own dashboard. At month-end rates it projects $12.83M of annual net returns against a 12-month target runway of $14.40M, a projected protocol surplus of -$1,566,693 [2]. Its own forward split puts Distribution Rewards at 77.95% of that projection and the Liquidity Layer at 11.91%, or $1.53M, close to the run rate the 6 basis point spread implies. On the protocol's own published numbers, the Distribution Rewards line set by Sky is most of the business model, and the model does not currently cover its costs.
Two things would change that picture, and both are worth watching in September. The Sky Savings Rate falling, which lowers Spark's cost of capital directly. Or the Liquidity Layer earning more on the half of its book that sits outside SparkLend. August delivered neither.
Methodology
Every figure in this report updates live on the Datum Labs lending terminal [1].
Sources. Fee, revenue, spread and Liquidity Layer composition come from Spark's own published financials at data.spark.finance [2], operated by Block Analitica. Deposits, per-chain splits, the peer set and prices come from DefiLlama [3]. SparkLend collateral composition is read on-chain from the protocol data provider. The window is 1 to 31 August 2026 against 1 to 31 July, both 31 days, so no day-count adjustment applies. Internal consistency was checked with 45 identities before drafting, all passing.
- Deposits are gross, meaning idle deposits plus active loans. DefiLlama's headline TVL is already net of borrows, so gross adds the per-chain borrowed series.
- Capital efficiency is active loans divided by net deposits. The constant-price version holds end-of-month token quantities at 1 August prices, which separates borrowing from repricing.
- The spread is the Liquidity Layer's asset yield less its cost of capital [8]. Spark publishes three different Liquidity Layer totals: allocated assets $2.29B, assets $2.64B and total assets $2.72B. This report uses allocated assets throughout except for the spread, which is calculated on total assets as Spark publishes it.
- Distribution Rewards are a payment from Sky, not product earnings. They sit inside family net revenue because Spark books them there, and they are separated wherever that distinction changes the reading.
- Stock metrics are monthly averages, flows are monthly totals.
Why DefiLlama's Spark revenue is not used. That adapter reads a Dune table published by Spark one day at a time and stores whatever it finds. It captured 100% to 102% of Spark's reported gross yield every month through April 2026, then 79.9% in May, 72.6% in June, 66.9% in July and 67.9% in August. Three July days match to the dollar while seventeen are short by more than $100,000, and the served series swings 51.6% day over day where the source moves 4.5%. Netting a full month of funding cost against a partial month of yield turns a profit into a loss: it reports -$649,334 for the Liquidity Layer in August where Spark's own accounting shows +$301,520. The defect has been reported to DefiLlama and affects the fee adapter only, not the TVL feed used here for deposits [6].
Gaps. Net revenue is 3.8% of gross, the small difference between two large numbers. Blockworks Research agrees with Spark on gross yield and on Distribution Rewards to within 1% across four quarters but books a 2% to 6% lower funding cost, which is enough to change the sign in some quarters [5], so gross yield, funding cost and the spread carry the analysis and net is treated as a range. Distribution Rewards settle as a monthly off-chain rebate and may be revised [7]; July and August ran materially below Blockworks as of 1 September with no revision published. Savings TVL is not reconciled: Spark's recap reports $4.9B [4], its own vault endpoint sums to $3.37B and DefiLlama reports $1.21B, so no Savings figure appears in any headline claim. Liquidity Layer composition is a month-end point-in-time read rather than an average, and its daily revenue is not published first-party, so the within-month split of earnings is inferred from the daily spread series.
References
- Datum Labs, "Lending Intelligence Terminal," live dashboard. https://www.datumlab.xyz/lending-terminal
- Spark Data Hub, operated by Block Analitica. https://data.spark.finance
- DefiLlama, Spark protocol. https://defillama.com/protocol/spark
- Spark, August 2026 recap. https://x.com/sparkfinance
- Blockworks Research, Spark. https://blockworks.com/analytics/spark
- DefiLlama dimension-adapters,
fees/spark-liquidity-layer. https://github.com/DefiLlama/dimension-adapters - Sky Forum, Monthly Settlement Cycle. https://forum.sky.money
- Spark documentation. https://docs.spark.fi
Data: Spark's own published financials at data.spark.finance, operated by Block Analitica, for all fee, revenue and spread figures; DefiLlama for deposits, per-chain splits and the peer set; SparkLend collateral read on-chain. Every figure updates live at datumlab.xyz/lending-terminal.
For informational purposes only. Not investment advice.